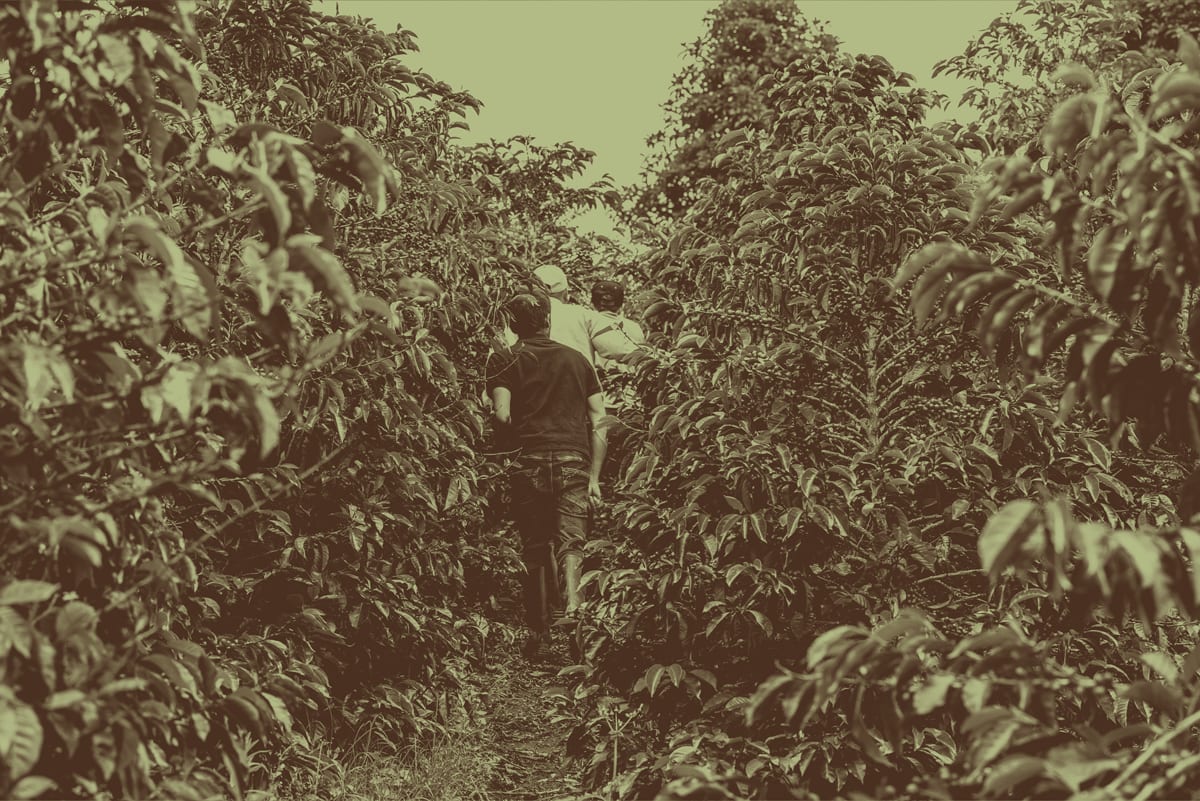
The EUDR signifies a collective step towards a better, more accountable coffee industry. It mandates that Caravela Coffee, though a Due Diligence Statement, assures all coffee entering the EU market is deforestation-free from December 31, 2020, and complies with origin country legislation for legal production. As your trusted partner, Caravela Coffee is diligently prepared to ensure seamless compliance with the EUDR; we have developed the necessary systems to provide continuous producer guidance and support, collect farm geolocation data, ensure the compliance traceability of each bean throughout milling, blending and exporting, from purchased lots to individual contracts, and a farm-to-farm forest degradation and deforestation risks assessment within coffee communities. At Caravela we embrace the EUDR and invite our roaster partners in Europe and around the world to join us in this journey towards a more responsible coffee industry.
We welcome the EUDR and are proud to leverage our years-long commitment to traceability to ensure full compliance. Our systems guarantee EUDR-compliant coffee to our roaster partners without imposing any extra costs on our producer partners.
Complying with EUDR: A commitment to Traceable Coffee
Farm Analysed
Area Analysed (ha)
Total deforested area (ha)
1000
4300
2%
*Deforestation Risks Assessed with Remote Sensing Technology (Open Source Maps)
Deforested area (ha)
Non-compliance (%)
Origins

peru

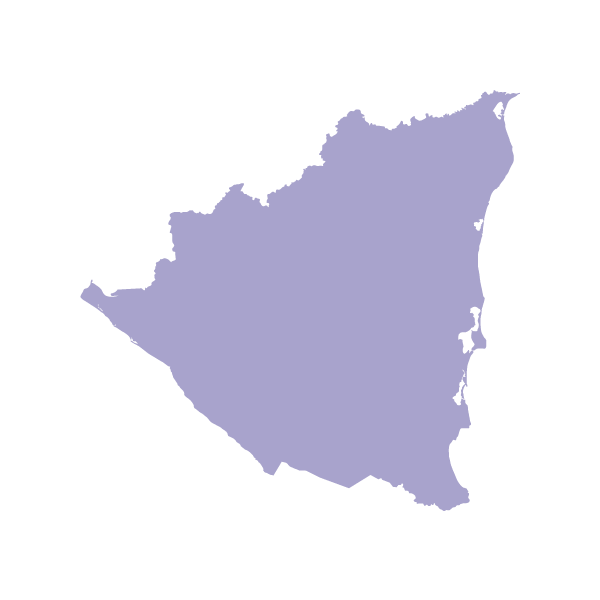
nicaragua

el salvador
13%
24%
4%
1%
2%
5%
28%

guatemala

mexico

ECUADOR

COLOMBIA
0,80%
3,58%
2,99%
0,01%
0,13%
0,38%
2,67%
Farm Analysed
Area Analysed (ha)
Total deforested area (ha)
1000
4300
2%
Deforested area (ha)
Non-compliance (%)
Origins
nicaragua
24%
peru
13%
0,80%
3,58%
el salvador
4%
2,99%
1%
guatemala
0,01%
2%
mexico
0,13%
5%
ECUADOR
0,38%
28%
COLOMBIA
2,67%
In 2023, we advanced our carbon emissions reduction plan, aligning with our 2021 baseline. While moving in the right direction, we keep building in our efforts to optimize land coffee freight logistics, to reduce company's vehicle emissions, to optimize energy use at dry mills, to promote hybrid work, and to develop innovative waste management partnerships. At Caravela, we remain committed to offsetting 100% of our scope 1, 2, and 3 emissions. Moreover, we support forest conservation by aiding rural households through ecosystem services and developing scalable insetting systems to mitigate environmental impact in Latin American coffee communities. Since our journey to net-zero includes a robust system for data collection and emissions tracking, ensuring transparency and accountability, we developed this year the "Greener Coffee" platform to enhance data gathering and real-time impact visualization, raising awareness and inspiring better decisions across our operation. Our dedication to innovative solutions and comprehensive support across our supply chain partners reinforces our leadership in environmental impact assessment and responsible coffee sourcing. Our "Greener Coffee" platform is now available for our roaster partners to engage with and use to structure and monitor their carbon reduction strategies.
Leading Supply Chain Environmental Assessment
Our Greener Coffee platform allows our roaster partners to discover the unique environmental story of the coffee they roast. At Caravela we have developed the necessary systems to assess the impact and support our supply chain partners in their journey through environmental stewardship and better decision-making.
Ton of CO2
2500
Scope 1
Scope 2
Scope 3
Direct Emissions from fuel consumption
Indirect Emissions from Electricity Consumption
Indirect Emissions from our Supply Chain
55,84
56,43
2,732
Kg CO2 / Kg Coffee Exported
Kg CO2 / Kg Coffee Exported (2022)
0.50
0.72
We aim to understand the relationship between net farm income and net farm greenhouse gas (GHG) emissions through a holistic assessment of farming practices in Latin American coffee communities. While farms with net-emitting GHG fluxes often yield more coffee due to increased use of synthetic fertilizers and lower tree density for crop shade, we have identified these farms also tend to generate higher incomes, allowing producers to invest in efficient infrastructure and better environmental practices, such as wastewater treatment and pulp residue management.
In contrast, net-sequestering farms, with higher shade tree density and fewer synthetic fertilizers, tend to have lower yields and therefore have lower incomes. Nevertheless, we have identified that farms in these communities often lack environmentally friendly practices and infrastructure due to limited access to farm inputs, resources and information. This could challenge the assumption that lower-emission farms are always more environmentally friendly. Caravela’s findings emphasize that household prosperity and environmental stewardship must coexist, advocating for a comprehensive understanding of farm dynamics and supporting farmers in navigating environmental risks and conservation beyond carbon regeneration and net-sequestering GHG rates.
There are intrinsic relationships that could exist between farm carbon emissions and farm total income. An awakening on how carbon sequestration requires a deeper context to guide responsible decision-making processes for coffee producers.
Regenerative Insights: Understanding Farm Carbon Emissions

FARM EMISSIONS BREAKDOWN (%)
below Prosperous Prices


12%
-5.9
13%
8%
*Prosperity Compass Data 126 Farms Assessed in 7 origins
Organic Fertilizer Production
Emissions Rate
(Kg CO2 / Kg Coffee)
Waste Water Treatment Plant
Pulp Management Pitfall
Above Prosperous Prices


11%
1,3
79%
39%
Productivity (kg pc/ha)
1,399
Fertilizers Use (Kg/ha)
909
Shade Density (trees/ha)
29
Productivity (kg pc/ha)
582
Fertilizers Use (Kg/ha)
149
Shade Density (trees/ha)
762
Fertilizer Use |
Fertilizer Production |
Pesticide Use |
Processing |
Energy Consumption |
Residue Management |
Transportation |
Waste Water |
Organic Fertilizer Production
Waste Water Treatment Plant
Pulp Management Pitfall
Emissions Rate
(Kg CO2 / Kg pc)


THE GREENER COFFEE CLUB
Greener Coffee is a solution that bridges common gaps in resource allocation and practical know-how when evaluating carbon emissions in the supply chain.
3.
1.
We developed Greener Coffee to support our roaster partners in navigating the intricacies of carbon footprint assessment.
2.
With comprehensive insights on emission sources, peak emission seasons, and full emissions traceability down to the employee level.
4.
Structure your own Carbon Reduction Plan. Build a resilient supply chain by using these insights to make informed decisions on your carbon mitigation and compensation strategies.
5.
A customizable approach built to match your expertise, needs, and emissions scope. Whether you are new to carbon assessment or looking for more in-depth insights, Greener Coffee adapts to your requirements.


